Wednesday, July 11, 2018

technical analysis as predictive, descriptive, and comparative

QQQ

The State of Technology Shares; uptrend, but possibly weakening?

  • Things threatening the uptrend
  • Technical Structure 
  • Possible mean reversion target 


The Candlestick Formational top is in place

  • Confirming the leg down has begun, unless stopped
  • 50 daily moving average (simple) is only at 171.50
  • Retest important base at 169-170
We believe that a return to $170 would be a target that is well within the bounds of most mean reversion trading systems.  

A bearish reversal pattern would normally need more time and momentum to prove that it works.  This one has some of the same characteristics as the prior crests from February, March, and then June.  

6-7 day basing pattern still occured whether it was this past cyle (buy the dip from last week)  or the countless other times over the past 2 years when a base would form, and it would take from 5-7 trading sessions before breaking out to newer highs and resume trend.  

Path of least resistance is down, yet the trend of "series of higher highs" is an important consideration.  

Tuesday, July 10, 2018

Revisiting NetFlix, the buyers that have returned

NFLX Daily Chart
enlarge these images to see the pictures fully


  • Buy the dip worked again 
  • Loosely fit rising trendline still supports
  • Volume became even drier over the past two weeks
  • Tops require more time
  • The importance of $423.21/share
NFLX went up 348% over the past 243 trading sessions, so we began doing some studies to find the candlestick patterns and other technical indications that the stock may have topped, and to what degree would we need it to drop before it has significant value again.  

One thing I may have not shared on the prior chart with this study is the upward moving trendline, price generally touched it enough for it to act more of a base of support than anything else.  Also, a trendline like this if broken and held below the current price's direction would flash a sell sign, at least temporarily.  

There are a few odd-ball scenarios when volume spikes happen in the high million count.  What I mean by that is when price traded at an interim top in April the volume count rose to above 30 million shares traded.  Then in mid-June volume spiked again to the 15-20 million range before price consolidated and moved higher toward 418.97 

Similar to how bottoms (base building) if they take more time it could be more of a coiling mechanism, and taken from another point of view tops could take more time to build as well, see how this next example has more of an "M" shaped topping formation:

Lastly,  the level 423.21 is so important for the bear case that if it is violated even on a quick flash it would discredit the bearish possibility of a return to a more discounted price for this asset.  


Monday, July 9, 2018

Swapping One Gap for Another

The Gap Fill Objective was Met, I told ya so


Theoretically VXX shares can trade down greater than 90%.  And if history is any precedent that has happened over the course of the 7-8 years this vehicle has been trading.  What this chart demonstrates is the oversold nature in which volatility has been suppressed so much, 39.72% is a real plummet in our book, so it might be overdue for a bounce

This analog also shows that the price declines greater than 35% were often followed by price gains between 25 and 45%

The Four Hour Chart


The measured move has already been nearly completed.  One of the most classic topping patterns is the head and shoulders top, and on this time frame it can be seen very clearly.  On the left edge from last Friday VXX surged and left a major imbalance in price, and price had 9 days before finally filling it.  Specifically,  the gap spanned between 33.15 and 34.25 on last Friday and was closed in the overnight drop.

When we captured this frame

It is still very early yet, but the bounce is in play!  After falling to 32.55, VXX begane to make its way out of the green box, the location of the box anyway was in a high demand price range, and although we admit it can break the bottom of these levels at 32.50 and below it still acted as a support beam, and could drive it higher into tomorrow and next week:  to 33, 34, 35, etc.

There are also very similar patterns with CBOE-S&P500 Vix too


Thursday, July 5, 2018

CVS might go to 69.50

Analyzing shares of CVS with Bollinger Bands
A value proposition in a defensive name


  • Effectiveness of Bollinger Bands to signal downside
  • Their use in testing intermediate term lows
  • Tendency to return back to the average
Because of recent news CVS gapped down, and since then it has been trying to rally back.  What we developed on this chart was a medium-term basing pattern and near the lower bands I placed blue arrows to note specific points.

The Timeline since March - trading range between $60.14 and $72

The first arrow near the yearly low at $60.14/ share was a point of maximum pain for the longs in the stock.  It has since returned back to the center and rallied above the upper band until April 24th

The second (arrow) attempt at closing below the bollinger band after 4/30 was met with a wave of buyers coming in to drive it to highs at and above $65.

The third arrow was not a touch of the lower band but it came in close proximity, being that it tested the lower end of the range at $62.75 it gave the buyers more enthusiasm and brought the price back up to $72+ which has proven hard to hold.  The higher band only acted as a resist point in the area around the 21st and 22nd of June at $72.30 which confirmed a bullish top and more evidence that the upper band would prove to be a barrier and not a confirmation point of runaway strength.  (several closes above the upper bollinger band typically mean that the security has more room to continue flying until it stalls)

The fourth and most recent arrow with the accompanying volume spike on 6/28 shows that the shorts are being shaken out and that it might start climbing above 65-66 and break out to make the push to 70 again.  It would be more of an advantage for the bulls to begin consolidating recent gains, and with the gap 6/27 so wide it might just fill with a week or so, but that is just our opinion of what the technicals are saying.  

Tuesday, July 3, 2018

Strong Foundation with A Weak Center


Daily and Monthly Charts

AAPL Monthly

  • Doji Month for June
  • Right edge of topping pattern
  • Mid- Range would be near 170
  • Light volume near 185-190


Plenty of buying opportunities and selling opportunities

Each leg down is like a trigger point for institutional buyers who are interested in the long term prospects of the company.  But the activation of those levels depends on the depth of the decline

  • The equilibrium is in the gap where we noted "weakness"
  • The height of the shaded rectangle notes where important buyers are setting their orders, 160 and 150
  • This ten point range is typical for AAPL
  • Breaking this more long term trendline would spell trouble for AAPL
  • The company reports earnings in less than one month!


Monday, July 2, 2018

July the Astrological Season of Cancer - Zooming out on the Dollar Month, Week, Day 2 hour

The Big Picture of the US-Dollar Index
Enlarge these charts to see the full image 

The Monthly Consideration - 602 points of gains
  • Nearly 6 months in a row, the dollar rallied and its starting to take the shape of a late-stage blow-off with waning momentum
  • There has not been a negative close or consolidation yet
  • The trend overall remains bullish, and the pullback most are anticipating is probably to consolidate its prior gains from Dec of last year until now

The weekly perspective with relative peaks at 12,110


Some of the topping tails are taking hold even if they are above the October highs of last year, there is still a big inflection point at 12,110 and above 

Most of the technical barriers to the upside were shattered, but it has since had some trouble closing above 12,113
Trouble on the Daily Chart


Sellers are taking more forceful action, and the patterns of more engulfing bearish candles are beginning to show up

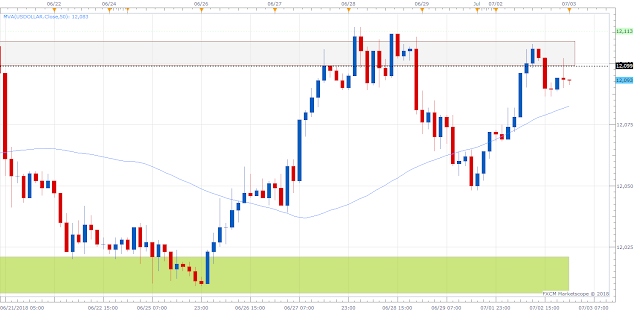
Tactics on the 2 Hour


  • The anti-dollar trade is setting up some clean boundaries for day trading tactics
  • The high above 12,100 (area) and below 12,025 support.  We would be shorting at 12,100 and going long at 12,025 but there will be contingencies
  • Price is approaching its 50-period moving average and getting ready to touch it and go below 

Sunday, July 1, 2018

Sticking to your Guns

The Recent Strength in the Canadian Dollar 

*enlarge these images to see it fully 


I posted this previously.  I thought the USD/CAD would retrace a major chunk of the zone and that it was a good time to get long the CaD.  Well here is the result of the trade.

The Daily Chart 


  • Sunday's action should probably be considered meek, because of the natural tendency to bounce back without many market participants
  • There are still another 25-50 pips left in the zone we created 


The 4-Hour Chart


  • Attempt for the buyers to reclaim a majority of the losses created on the long red candle created at 9AM - it was 95 pips in magnitude
  • This segment of time is more of a display of the range where equilibrium is more of a middle-ground between 1.32 and 1.3215, I believe it can climb that much possible before resuming the last bits of the slide 


The 60-minute chart


  • More detail on the way it consolidates
  • On the most recent set of declines it typically consolidated a few times before making the next swing down
  • This could be a set-up for a false flag which means the buyers are signalling a rally when in fact they don't have enough strength to lift it much higher than 1.32
Our ultimate target in this whole test of CaD strength is for the USD/CAD pair to hit 1.30887 but of course we are open minded to as much dollar weakness as possible.