Mirror Opposite
The Opposite Movement of the Financials ETF (FAS)
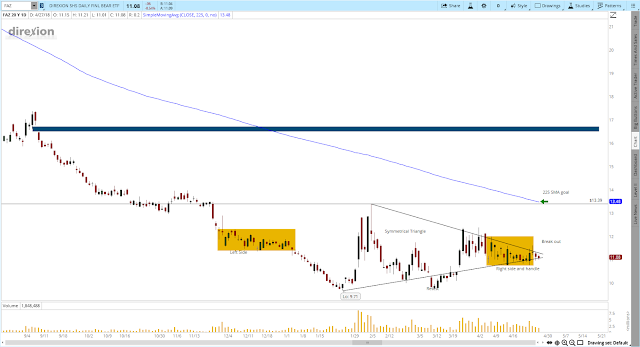
This is a daily chart for the ETF called FAZ. It moves the inverse of the financials and during times of turmoil it performs very well.
- Tendency of mean reversion (ie) the blue zone shaded above has a gap in the mid $16 to 17 range
- An abnormal head and shoulders bottom with shaded zones to mark consolidation points
- A triangle pattern with a good amount of clarity from the top near 13 and all time low at $9.71
- Shown here 225 moving average coming down into price at 11.08
In percentage terms, a move to 13, or even 20 nearly doubles this "asset" but its not that much of a stretch considering it traded in the hundreds before, and with some pressure from the stock, bond and financial companies having stress, there are some technical reasons why this can trend higher.
Gap Fill
One of my favorite studies is setting goals around gaps to be filled or perceived "air pockets" that is to say at the 16.50 or higher mark created in September of last year initiated another steady downtrend, and I think that a move to possibly 16.50 is the goal for next few weeks.
Head and Shoulders Bottom (Inverse)
So we have two examples of consolidation shaded by the yellow zones, the first or left shoulder is when price was confined to 1.5 to 2.5 points before finally having that last slide down to 9.71. The other yellow zone to the right doesn't have an exit yet, but to validate the pattern it would have to go through 11.78 or do even better to continue the positive momentum started in early February.
Triangle
Other charts are starting to show similar set-ups, this triangle here is drawn from the peak on 2/5 and that descending trend line and it intersects with the uptrend line from the all time lows, any slight break of this triangle would indicate a change in direction or continuation, time will tell.
The 225 Simple Moving Average
Tomorrow and next week the SMA will continue going down to catch up with price, but it would be interesting to see how long that does take, in February of this year the Average True Range of this ETF was within 1.48 so it won't take that much time for it to get to a 13.48 target.
Monetary policy, the state of our government, and how the Bond market trades will all weigh on the conditions for the financials, this May until November should be fun and interesting times to trade, and when there is a crisis there is an opportunity.

No comments:
Post a Comment