Wednesday, August 2, 2017
Energize: Keep Bringing on the Heartache
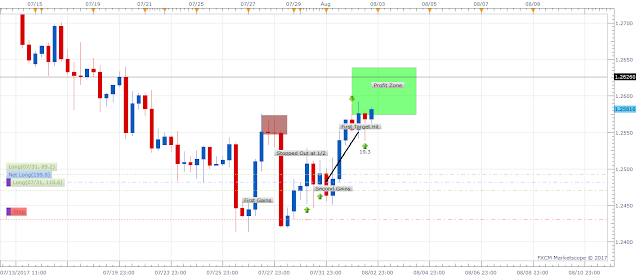
The first chart is 6 - hour chart and I labeled the first gains to show how I was able to close on the first bounce. I unexpectedly closed my entire position. I then took another long position where I was stopped out of half of it. But I still held the low 1.25 and in between 1.245. The second gains is where I added to my position and overhead I had I targets set the first rectangle. There is no reason to sell out of a winning position so I labeled the profit zone above. And I will be planning another exit where each of the positions are closed by 1/4 and 1/5 of the weight I put in them. This layering out allows me to build the position without having too much risk and then raising my stop
Stop Placement The truth is I do not know how far price can move against me but at the moment I drove a stake in the ground at 1.2450 and the red line is where I will stop the bleeding, if it should move against me but even then a 50% retracement I will consider getting out of a majority anyway. Support Points, Fractal nature of bounces
What I have on the one hour chart is a snapshot of what the retracement look like in context to how far deep it pulled back in and uptrend. The first arrow is 45 pips and the second arrow is 25 pips the third arrow is 43 pips and the last arrow is 47 pips There is a 147 pips distance from the beginning of the trendline to the end and what I wanted to show with that was highlight how price will take three steps forward and two steps back and five steps forward and three steps back but not in that order hopefully you get the picture Exits
as far as protecting profits and taking out portions of the position I plan on projecting in terms of the average true range and stiff resistance points on average 100 but for this I will need to compare the daily chart 6 hour chart. If there is an opportunity for a move of higher than hundred pips I will wait longer to sell
Daily Climbing The Four Day Win Streak
the daily chart in the third image highlights what I believe are similar types of movement. The rally from February to mid May became weak and for that reason the ranges got shorter before the Bears took over. The fractal nature of this suggests that the blue candlesticks can be and can shift around 115 pips higher a day and then make their retracements. The pair dropped 1,372 pips since 5.11.2017 {Crest to Trough}
Subscribe to:
Post Comments (Atom)


No comments:
Post a Comment